
Sources of Air Pollution
Source Attribution of Particulate Matter Pollution
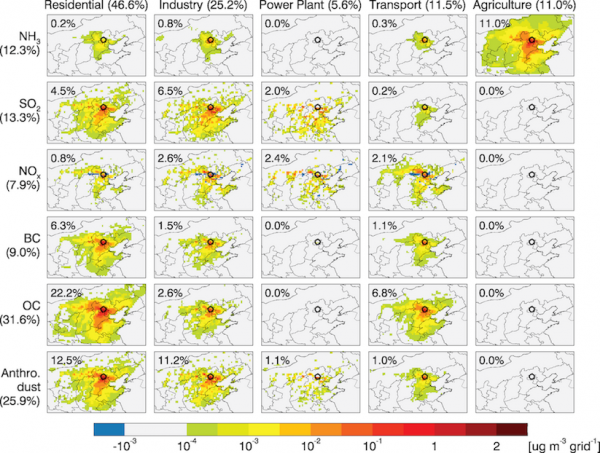
The figure shows sensitivity of surface PM2.5 concentration over Bejing to aerosol emissions over North China averaged for January 2013-2015 as computed by the GEOS-Chem adjoint model. Sensitivities are separated by different emissions sectors and chemical species at the model 1/4° × 5/16° horizontal resolution. The numbers represent percent contributions of sensitivity from the specific emissions to the total sensitivity summed over all emissions and over the model domain. The open circle denotes the location of Beijing.
Adjoint analysis of ozone sources
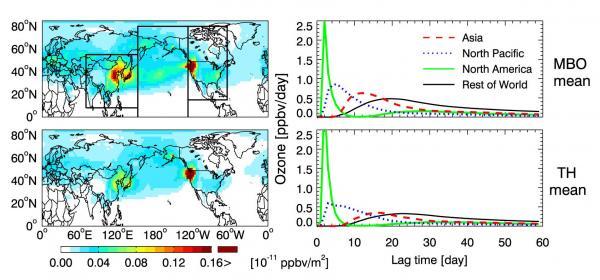
We use the GEOS-Chem chemical transport model and its adjoint to quantify source contributions to ozone pollution at two adjacent sites on the U.S. west coast in spring 2006: Mt. Bachelor Observatory (MBO) at 2.7 km altitude and Trinidad Head (TH) at sea level. The adjoint computes the sensitivity of ozone concentrations at the receptor sites to ozone production rates at 2 x 2.5 resolution over the history of air parcels reaching the site.
The figure below shows sensitivity of ozone concentrations at Mt. Bachelor Observatory, Oregon (MBO, 2.7 km altitude) and Trinidad Head, California (TH, sea level) to ozone production worldwide for the INTEX-B period (April 17 – May 15, 2006). The left panels show the sensitivities integrated in time, over the depth of the tropospheric column and at the 2×2.5 grid resolution of the model. The right panels show the time-dependent sensitivities (going back in time) to ozone production over Asia, the North Pacific, North America, and Rest of World (as indicated by rectangles). For more information, please see Zhang et al. [2009] [pdf].
Background ozone concentrations over the Intermountain West US
We improved the GEOS-Chem global 3-D model of atmospheric composition with 1/2° × 2/3° horizontal resolution over North America and adjacent oceans (2° × 2.5° for the rest of the world) to estimate three-year statistics (2006-2008) of surface ozone pollution over the US.
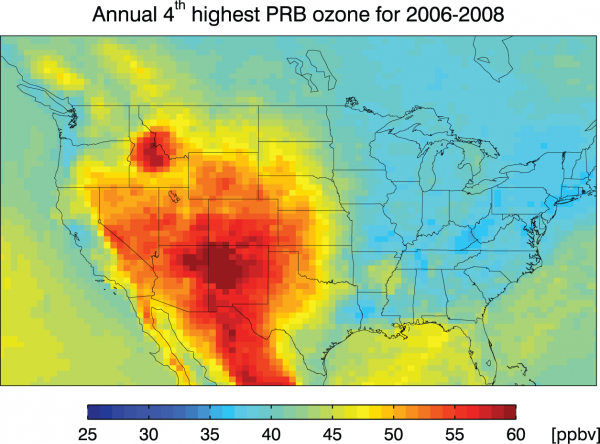
The policy-relevant background (PRB) ozone is defined by the US Environmental Protection Agency (EPA) as the surface ozone concentration that would be present over the US in the absence of North American anthropogenic emissions. It is intended to provide a baseline for risk and exposure assessments used in setting the National Ambient Air Quality Standard (NAAQS).
Figure on the right shows the 4th-highest value of North American background ozone (PRB) calculated in GEOS-Chem as daily 8-hr maximum ozone and averaged for 2006-2008. We are now investigating the influences of stratospheric intrusions, lightning, and wildfires on the surface ozone air quality over the intermountain west US.
For more details see Zhang et al. [2011] [pdf].
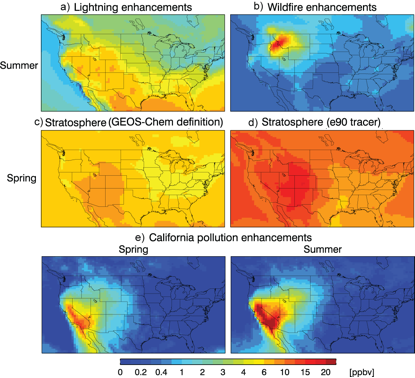
We isolate contributions of lightning, wildfires, the stratosphere, and California pollution to background surface ozone concentrations in the US Intermountain West. We find that Lightning increases mean surface ozone in summer by 10 ppbv in the Intermountain West, with moderate variability. Wildfire plumes generate high-ozone events in excess of 80 ppbv in GEOS-Chem, but CASTNet ozone observations in the Intermountain West show no enhancements during these events. Models may overestimate ozone production in fresh fire plumes because of inadequate chemistry and grid-scale resolution. The highest ozone concentrations observed in the Intermountain West (>75 ppbv) in spring are associated with stratospheric intrusions. Discrepancy between models in diagnosing stratospheric influence is due in part to differences in definition, i.e., whether stratospheric ozone is diagnosed as produced in the stratosphere or as transported from above the tropopause.
A full description is given in Zhang et al. [2014] [pdf].
Intercontinental Transport of Ozone Pollution
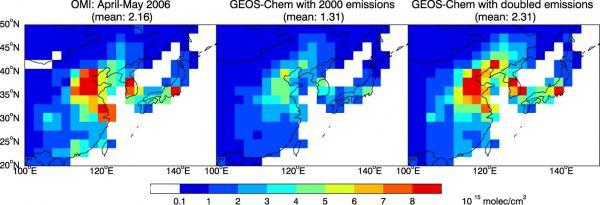
We use an ensemble of aircraft, satellite, sonde, and surface observations for April-May 2006 (NASA/INTEX-B aircraft campaign) to better understand the mechanisms for transpacific ozone pollution and its implications for North American air quality. The observations are interpreted with a global 3-D chemical transport model (GEOS-Chem). OMI NO2 satellite observations constrain Asian anthropogenic NOx emissions and indicate a factor of 2 increase from 2000 to 2006 in China. Satellite observations of CO from AIRS and TES indicate two major events of Asian transpacific pollution during INTEX-B. Correlation between TES CO and ozone observations shows evidence for transpacific ozone pollution. The semi-permanent Pacific High and Aleutian Low cause splitting of transpacific pollution plumes over the Northeast Pacific. Both aircraft measurements and model results show sustained ozone production driven by peroxyacetylnitrate (PAN) decomposition in the southern branch, roughly doubling the transpacific influence from ozone produced in the Asian boundary layer.
Figure: Mean tropospheric NO2 columns from OMI and the GEOS-Chem model in April-May 2006 over eastern Asia. The OMI data (left panel) have been mapped on the 2×2.5 GEOS-Chem grid. GEOS-Chem model results are shown using 2000 anthropogenic NOx emissions from Streets et al. (2003) (central panel) and a doubling of these emissions to represent 2006 conditions (right panel). For more details see Zhang et al. [2008] [pdf].