摘要:
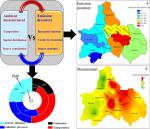
In order to evaluate the volatile organic compounds (VOCs) pollution characteristics in Chengdu and to identify their sources, ambient air sample collection and measurement were conducted at 28 sampling sites covering all districts/counties of Chengdu from May 2016 to January 2017. Meanwhile, a county-level anthropogenic speciated VOCs emission inventory was established by “bottom-up” method for 2016. Then, a comparison was made between the VOCs emissions, spatial variations, and source structures derived from the measurement and emission inventory. Ambient measurements showed that the annual average mixing ratios of VOCs in Chengdu were 57.54 ppbv (12.36 to 456.04 ppbv), of which mainly dominated by alkanes (38.8%) and OVOCs (22.0%). The ambient VOCs in Chengdu have distinct spatiotemporal characteristics, with a high concentration in January at the middle-northern part of the city and a low concentration in September at the southwestern part. The spatial distribution of VOCs estimated by the emission inventory was in good agreement with ambient measurements. Comparison of individual VOCs emissions indicated that the emissions of non-methane hydrocarbon species agreed within ±100% between the two methods. Both positive matrix factorization (PMF) model results and emission inventory showed that vehicle emissions were the major contributor of anthropogenic VOCs in Chengdu (31% and 37%), followed by solvent utilization (26% and 27%) and industrial processes (23% and 30%). The large discrepancies were found between the relative contribution of combustion sources, and the PMF resolved more contributions (20%) than the emission inventory (6%). Overall, this study demonstrates that measurement results and emission inventory were in a good agreement. However, to improve the reliability of the emission inventory, we suggest significant revision on source profiles of oxygenated volatile organic compounds (OVOCs) and halocarbons, as well as more detailed investigation should be made in terms of energy consumption in household.
访问链接

