摘要:
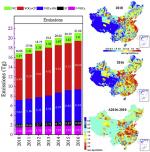
Volatile organic compounds (VOCs) pollution, which is closely linked to photochemical smog and secondary organic aerosols, has become a severe concern in China. Therefore, we compiled a new high-resolution emission inventory for the industrial non-methane Volatile organic compounds (NMVOCs) using “bottom-up” approaches throughout 2010 and 2016. In this work, the industrial sources were divided into five major categories, and 108 specific sources, as well as an emission factor database, was developed for industrial NMVOCs. Results indicated that the total NMVOCs emissions from industrial sources increased from 16.88 Tg in 2010 to 21.04 Tg in 2016 at an annual average rate of 3.7%. The five major source categories including “production of VOCs”, “storage and transportation”, “industrial processes using VOCs as raw material”, “processes using VOCs-containing products”, and “fossil fuel combustion” generated 1.92 Tg, 0.94 Tg, 6.54 Tg, 10.04 Tg, and 1.60 Tg NMVOCs, respectively, in 2016. Coke production, plastic manufacturing, raw medicine industry, and architectural decoration were the primary sources of industrial NMVOCs and emissions of these sources increased by 140 Gg, 190 Gg, 640 Gg, and 700 Gg between 2010 and 2016. The emissions displayed distinct spatial characteristics, with significantly higher emissions in the Beijing-Tianjin-Hebei region, the Pearl River Delta, the Yangtze River Delta, and the Cheng-Yu region than in other areas. Shandong, Guangdong, Jiangsu, Zhejiang, and Henan were the top five provinces with the highest NMVOCs emissions, while the emission hotspots in the county-level were mainly distributed in Guangzhou urban area, Shanghai Pudong New Area, Hangzhou urban area, and Shenzhen urban area. The emissions in Henan province, Hubei province, and Cheng-Yu region increased significantly during the study period. Instead, emissions in some counties of Zhejiang province and Hebei province decreased than in 2010.
访问链接

